We were tasked with helping define next steps for the product ‘Moata Net Zero’ - a carbon reporting tool which would bring together the pockets of excellence being demonstrated across Moata and the wider industry into a common offering
We wanted to build on the team’s existing market investigations, validate the understanding that had been synthesised and provide further stimulus material for MNZ to provoke deeper investigation and help identify the opportunity areas and product-market fit.
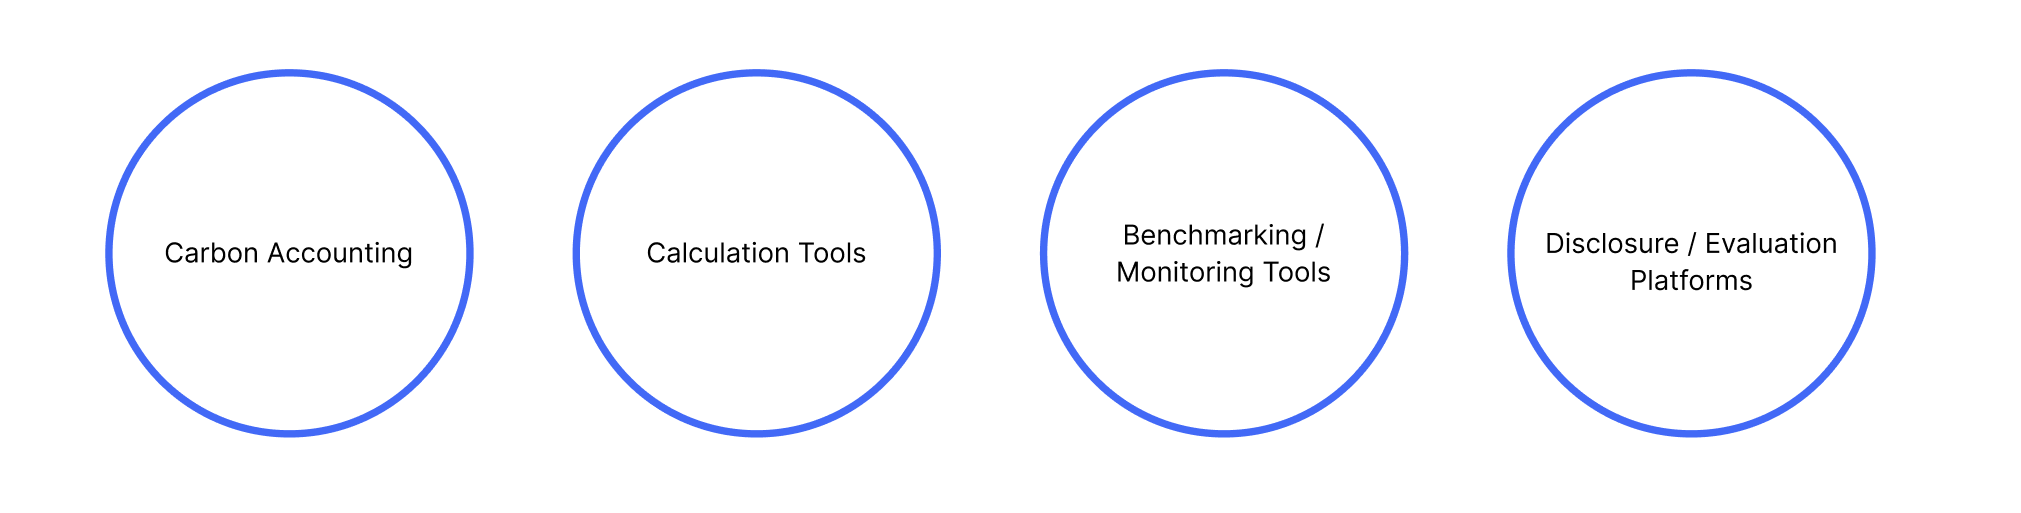
We had a look at the different types of carbon reporting tools currently being used by organisations - we wanted to know what MNZ could build on or learn from these. The main areas of carbon were:
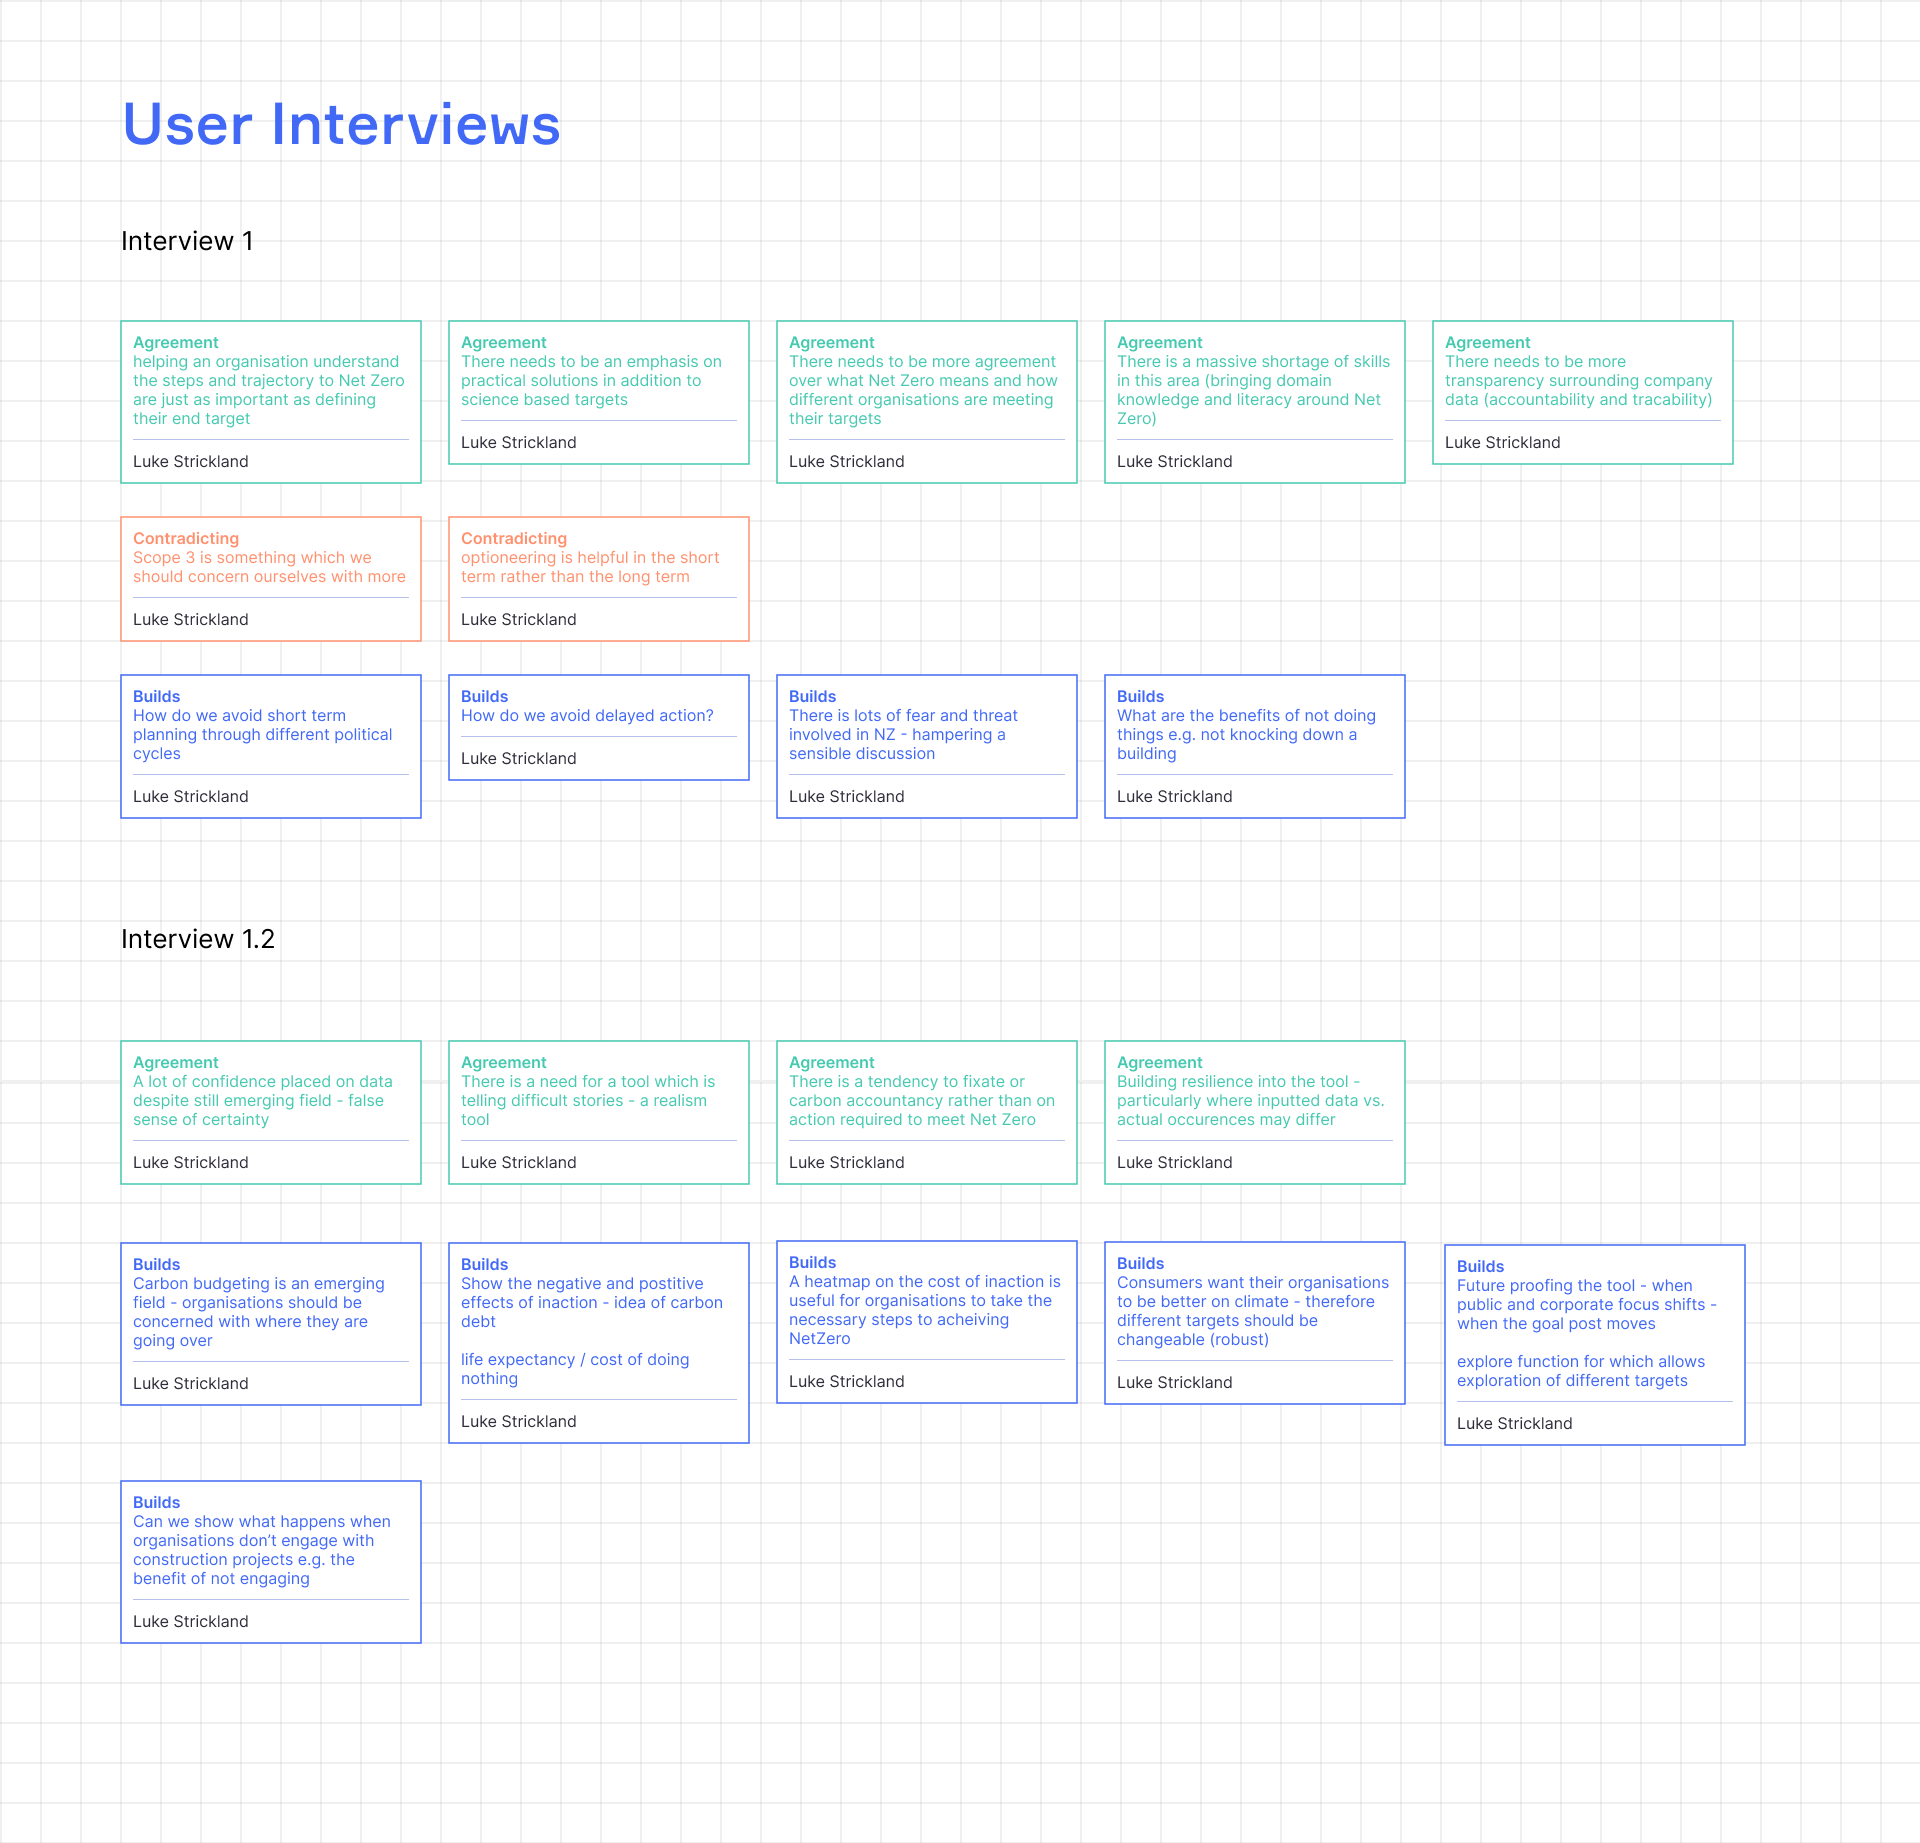
We spoke to a number of experts on net zero strategy and carbon reporting to start validating hypotheses the MNZ team had put together. We also started identifying new areas of opportunity which hadn't already been explored
Below is an example of how we broke interview insights into three categories: 'Agreement', 'Contradicting' and 'Builds' to help with the process of confirming / articulating new opportunity areas.
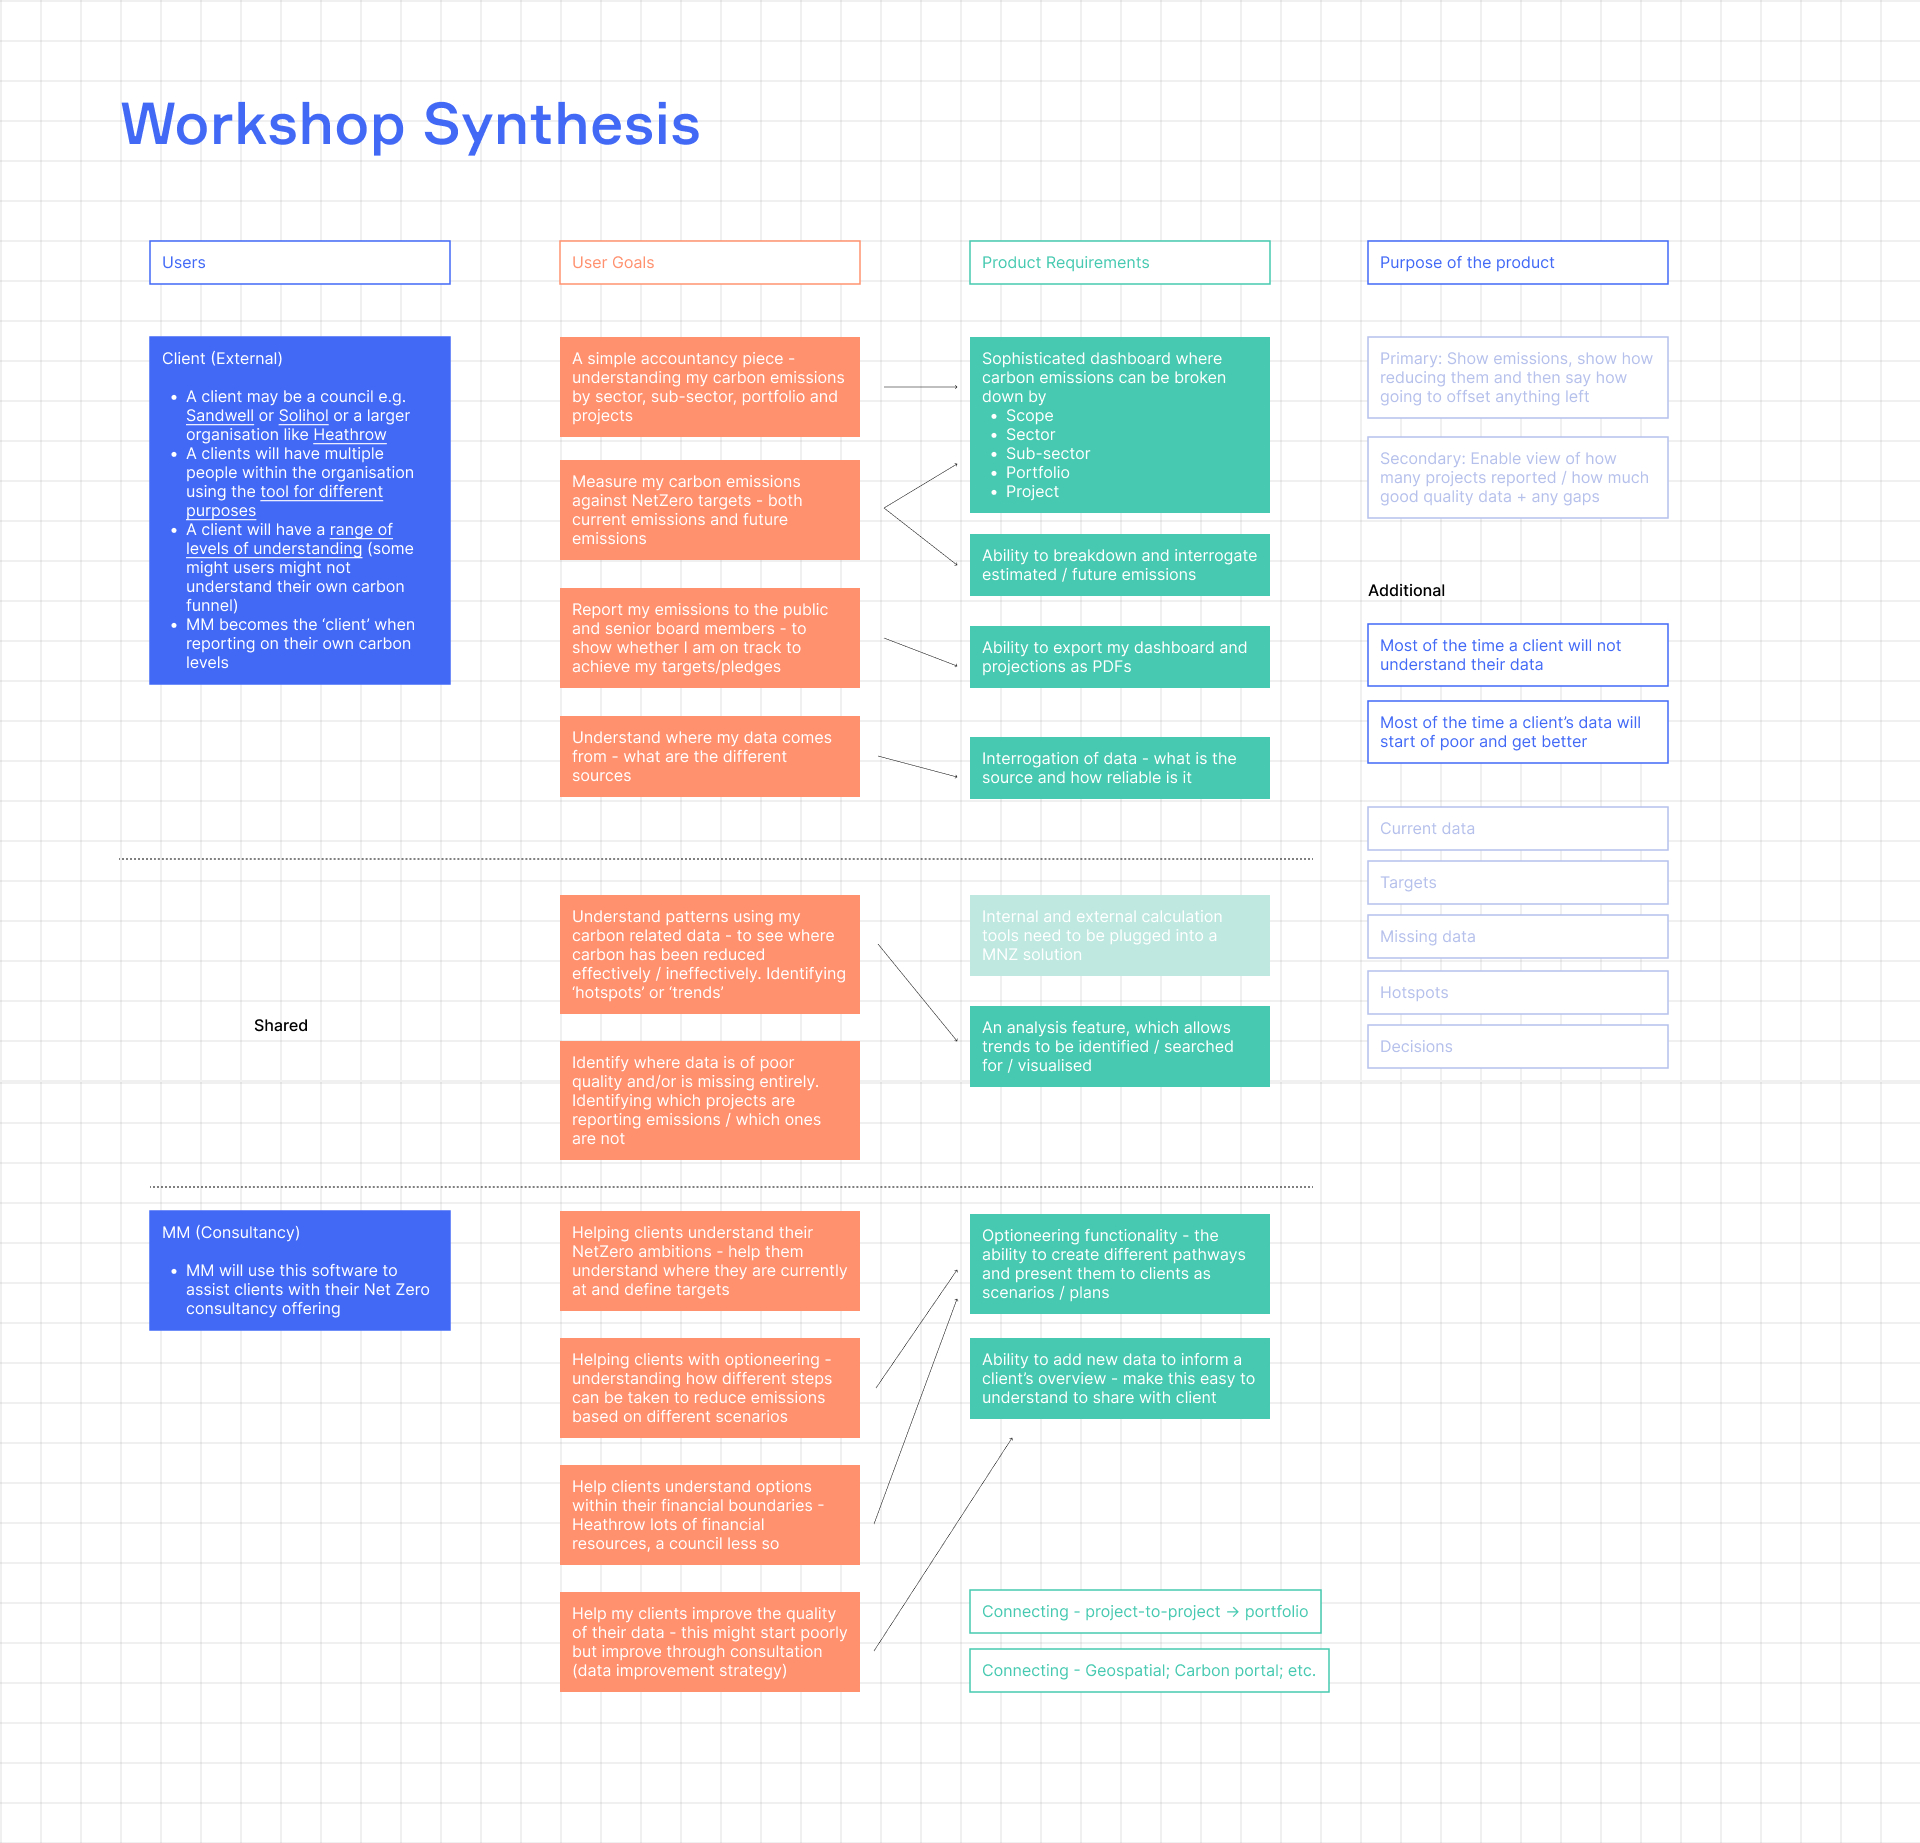
We also held a number of workshops with the MNZ team and important stakeholders to gain further insight into the world of carbon reporting and net zero strategy.
Below is a consolidation of thoughts and ideas expressed in one of the workshops around 'User Goals' and 'Product Requirements'
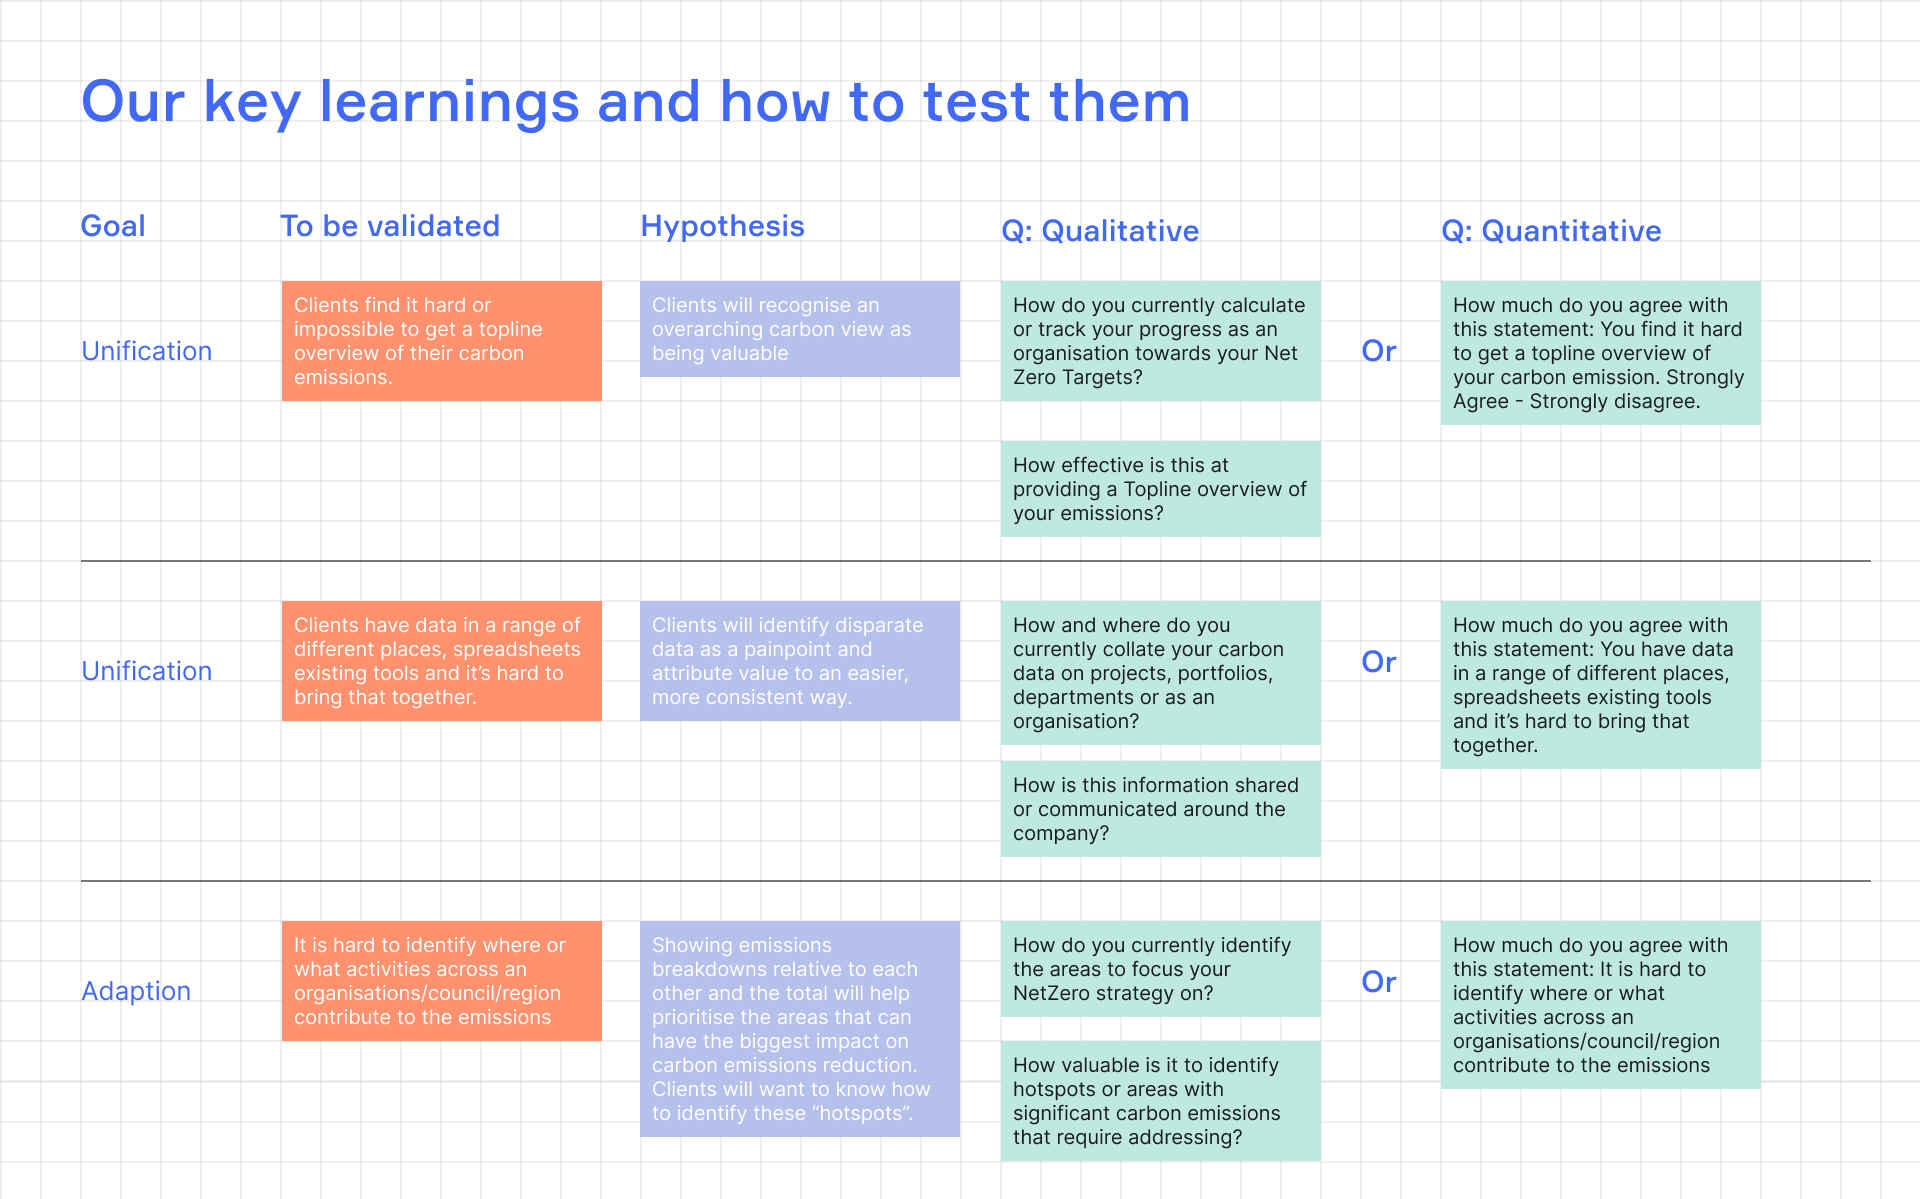
Building on our workshops and user interviews we put together 15 evidenced hypotheses for the MNZ team to further explore with their stakeholders. We accompanied each hypothesis with a quantitative and qualitative question to help the MNZ team test their relevance.
Below is an example of three of the hypotheses we put together.
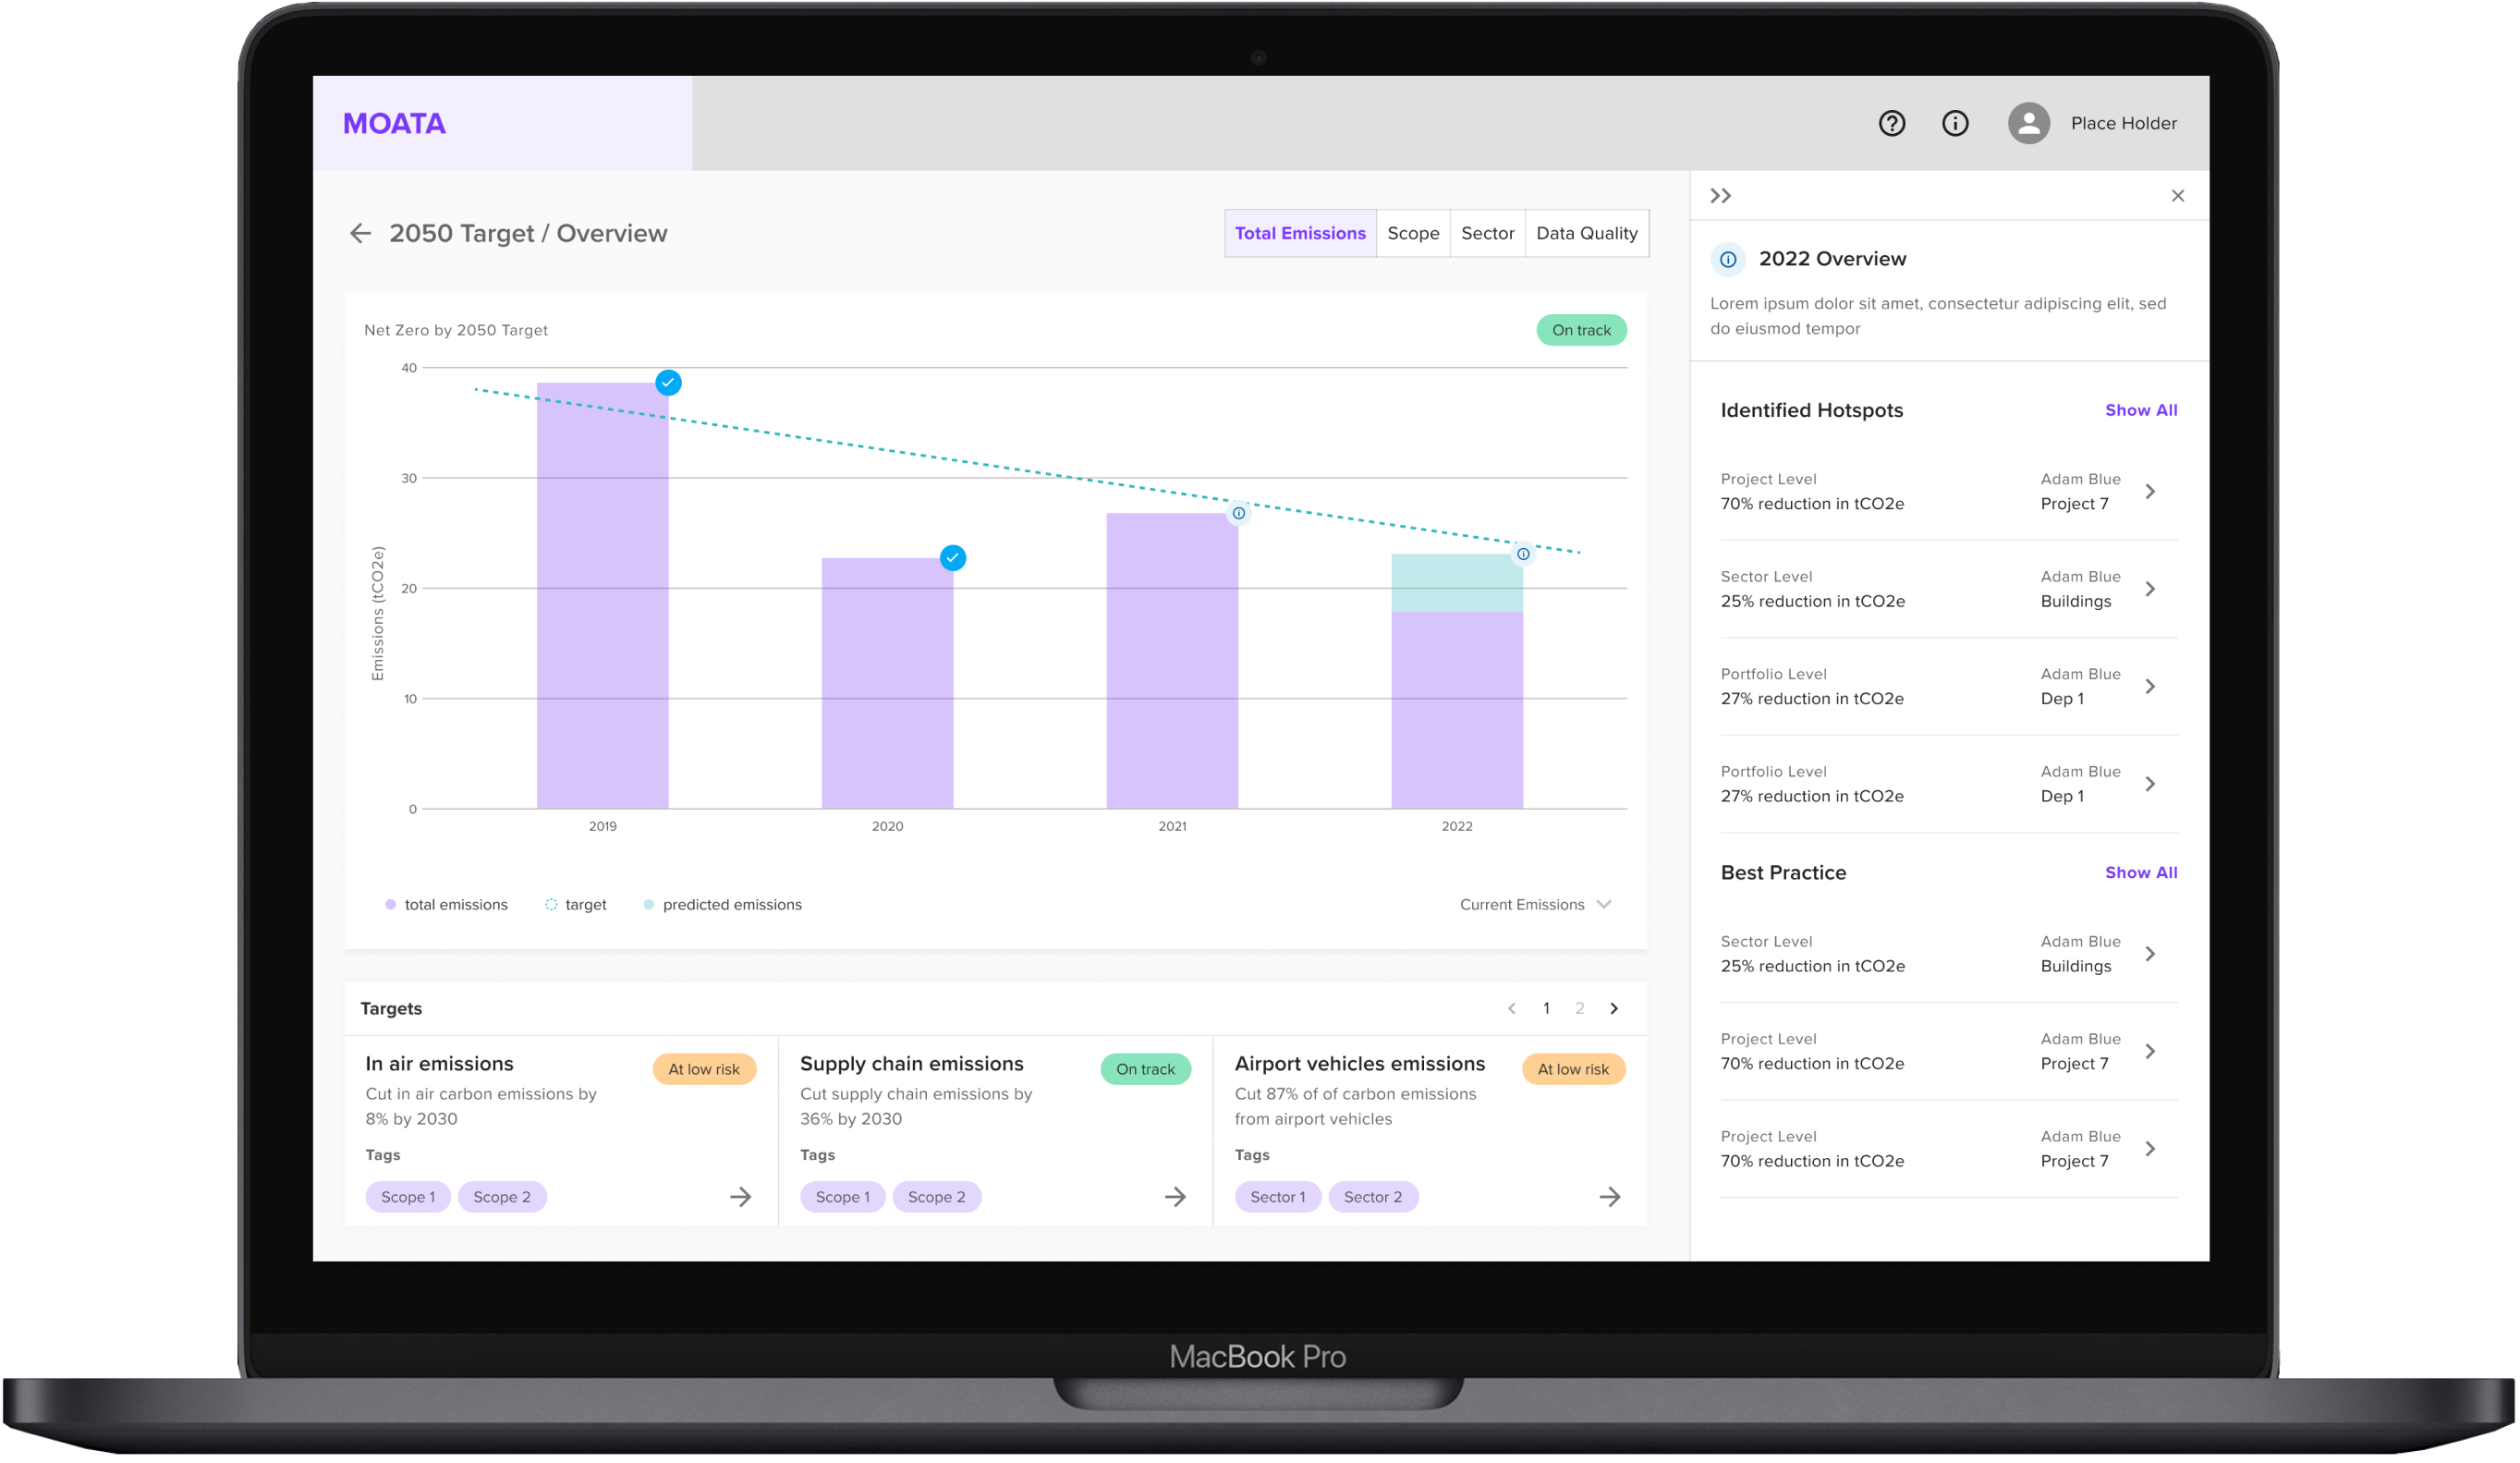
To help the MNZ team test our hypotheses with their stakeholders we built a small prototype. This would stimulate conversations and help stakeholders imagine what functionality the carbon reporting tool might have in the future
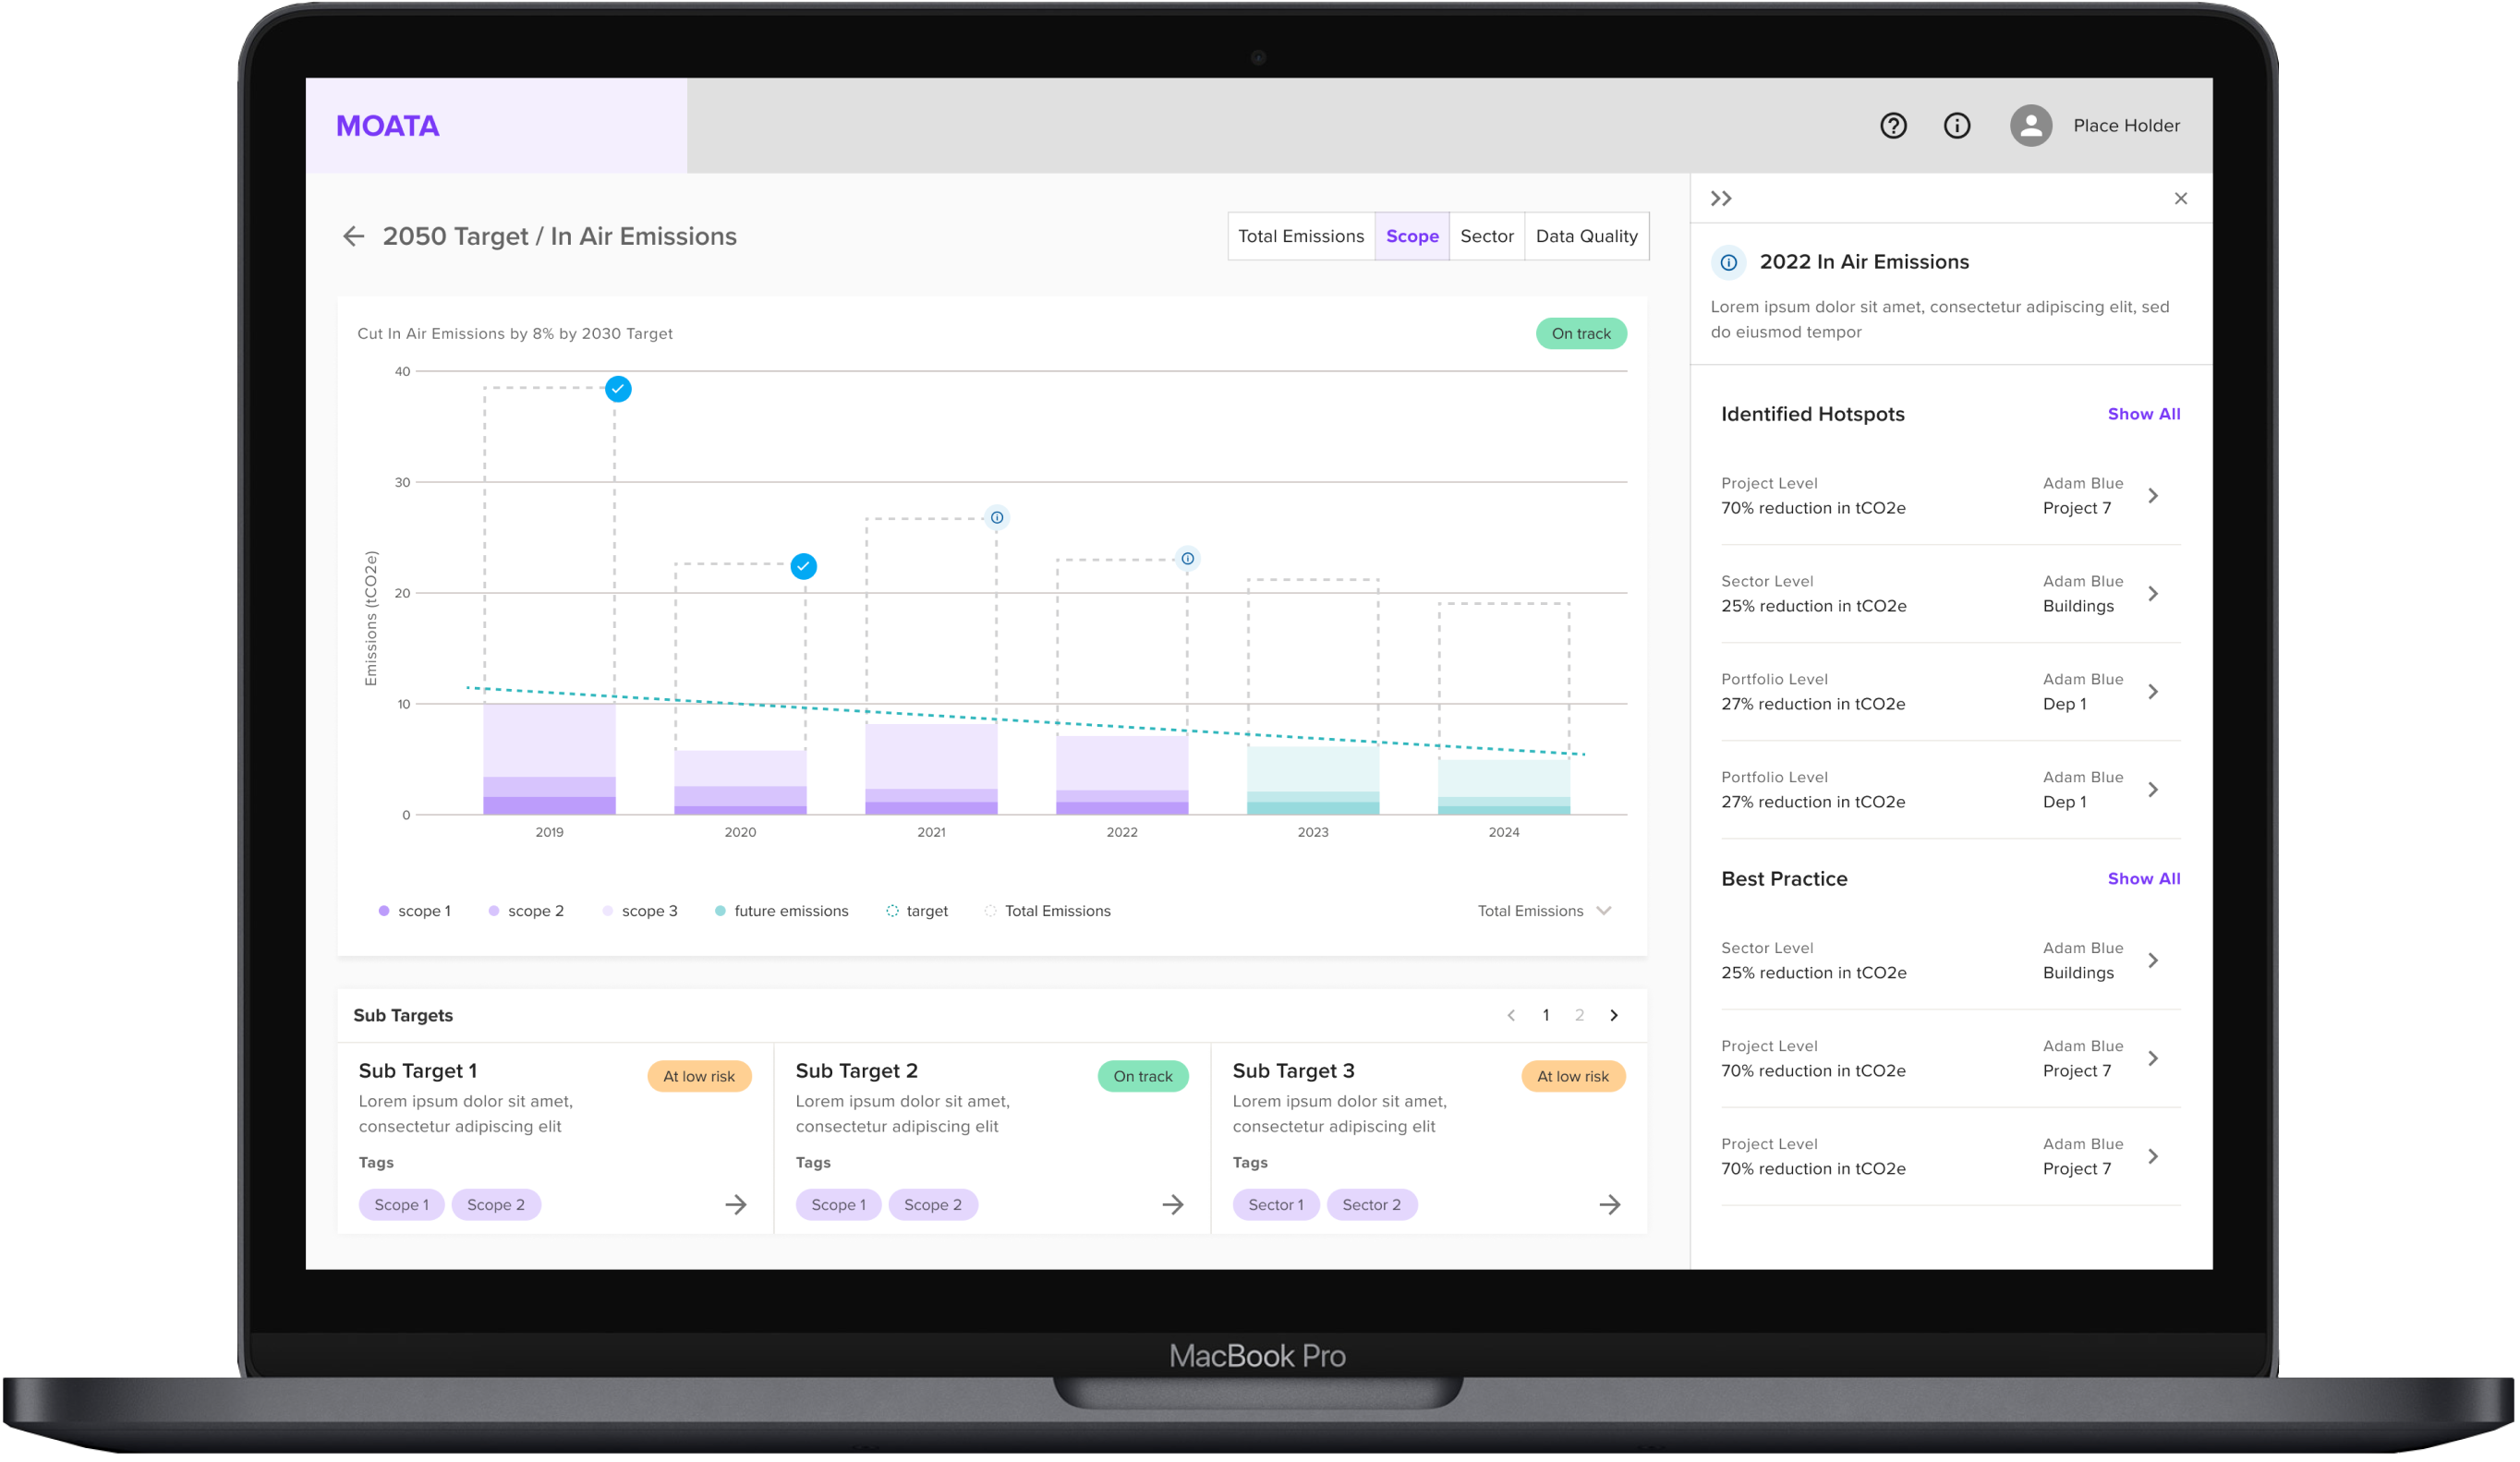
The screen above shows how clients might create carbon reduction 'goals' and see the progress they are making towards these.
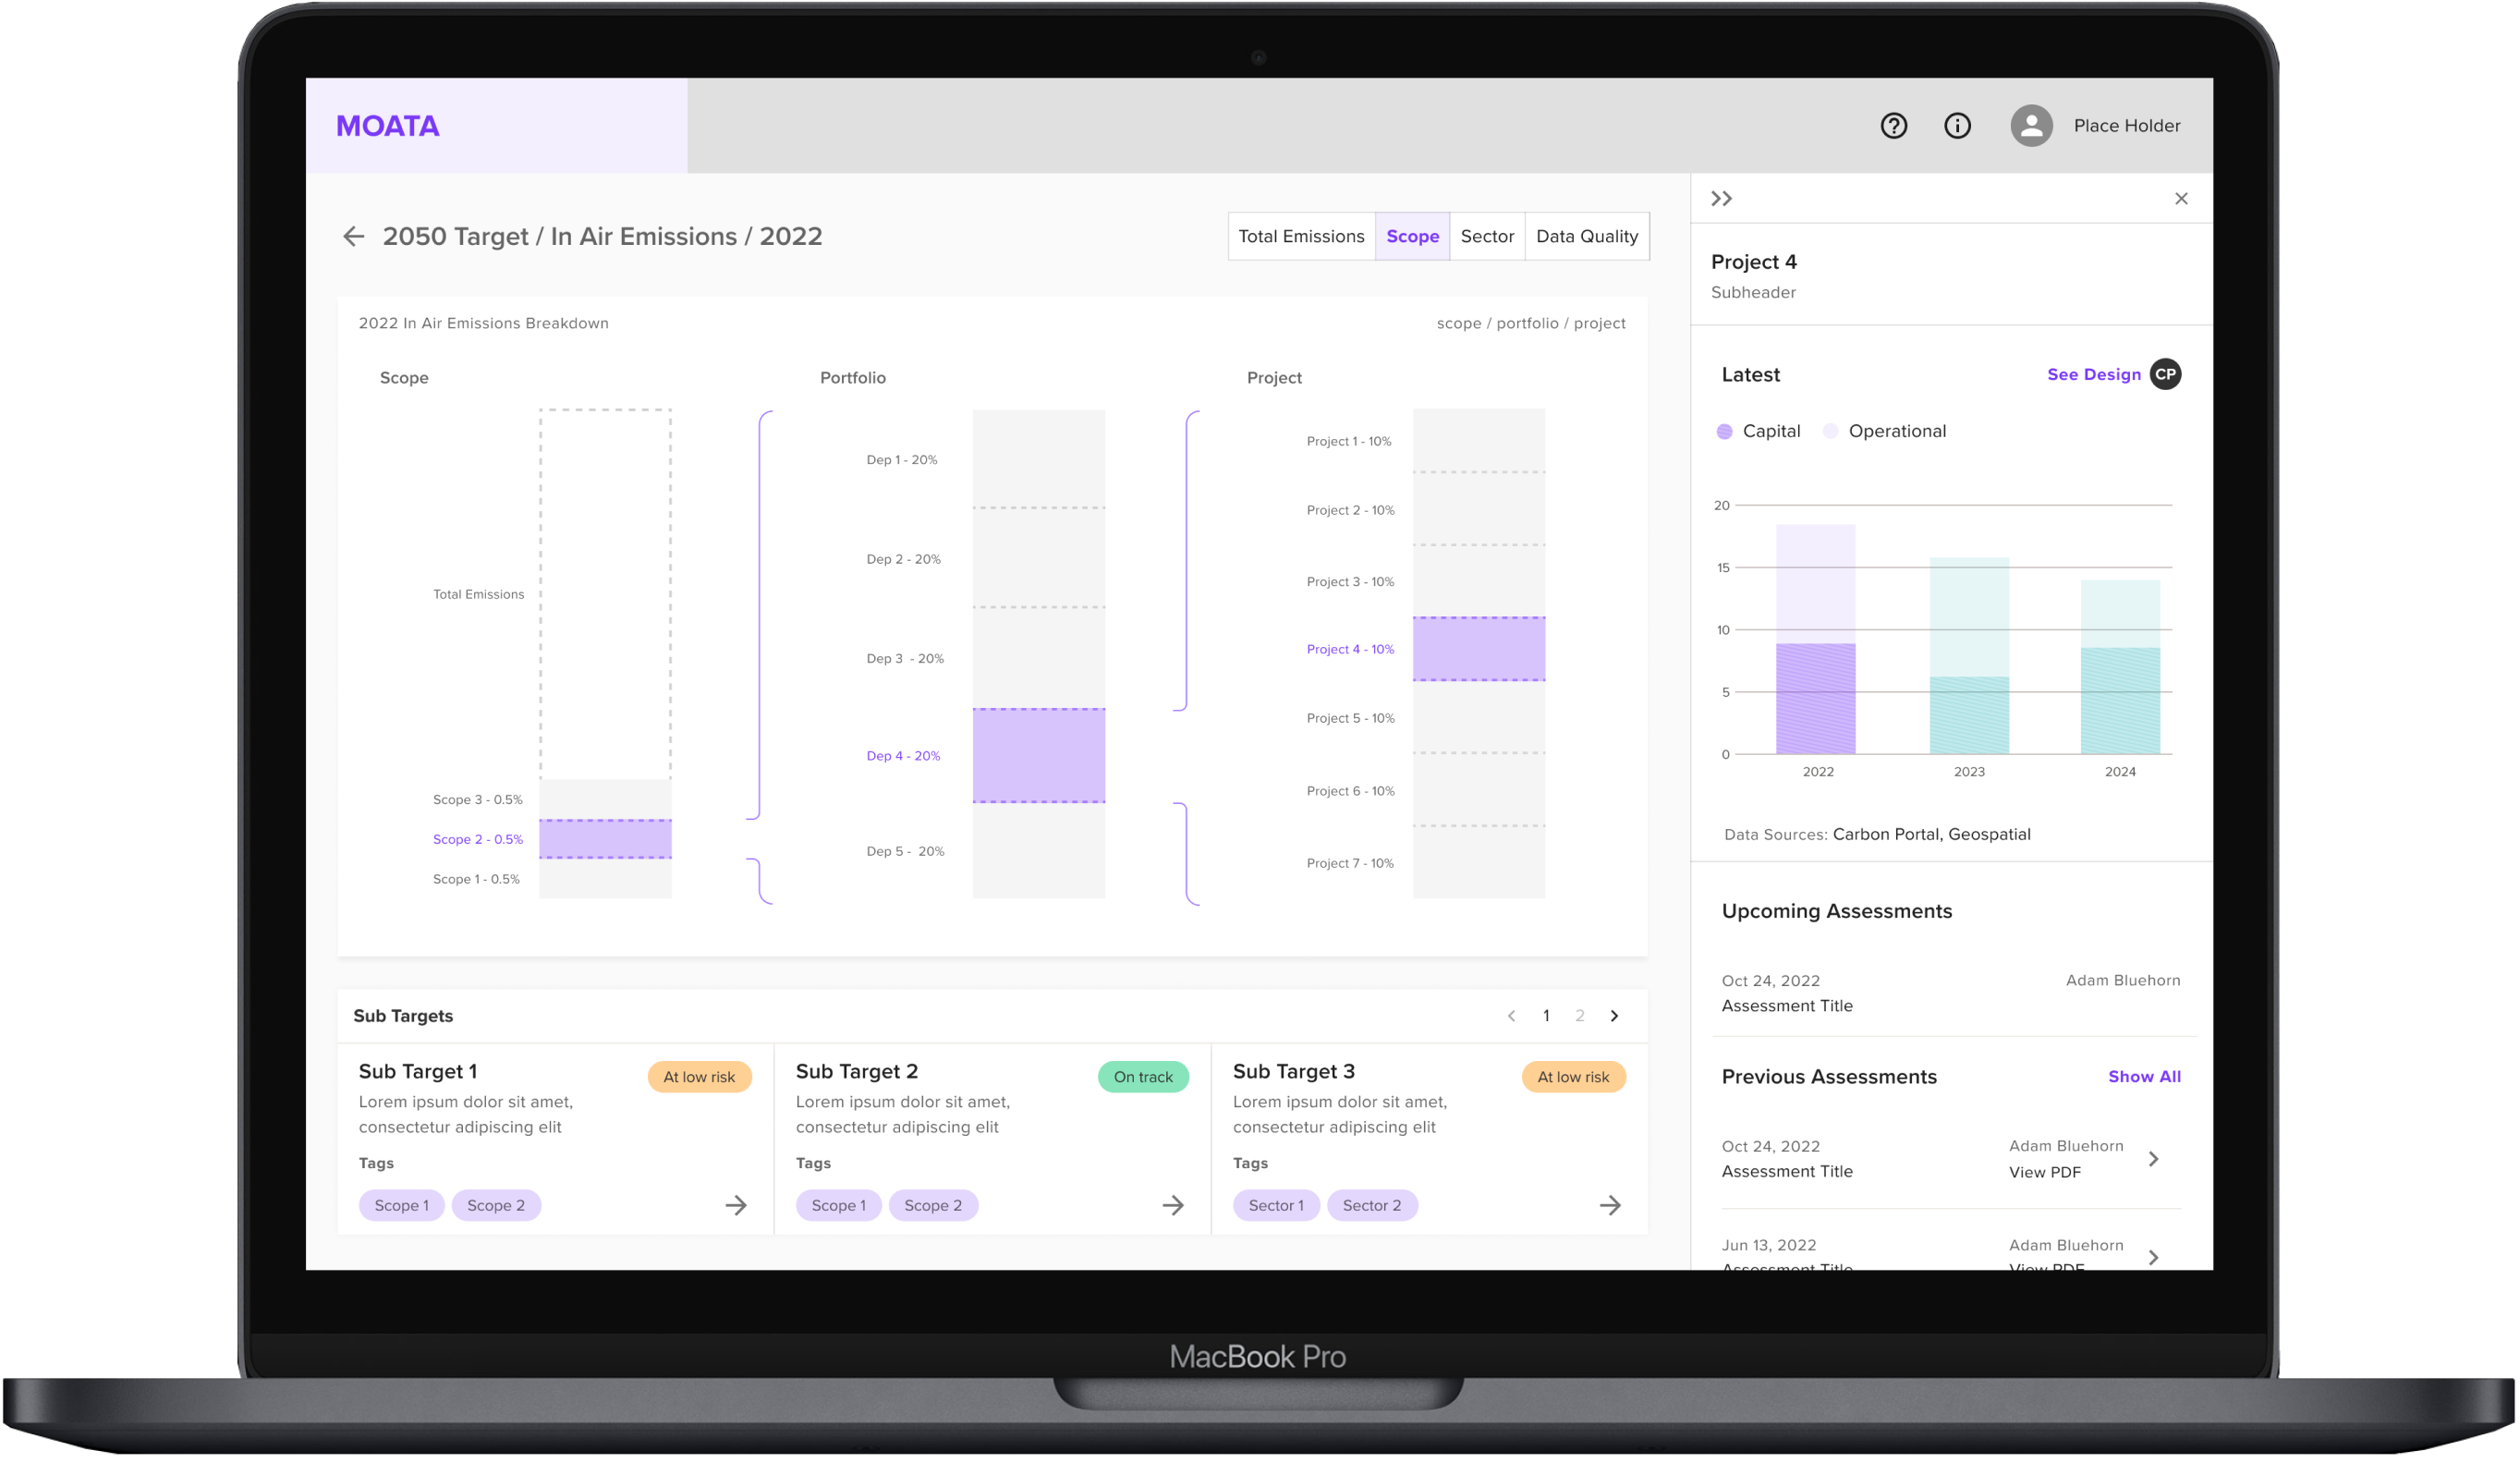
The screen below shows how carbon emissions can be broken down by 'Scope' 'Sector' and 'Data Quality' to provide valuable insight.
Next Project